

NEW SERIES: How much more are ACA enrollees *really* paying due to Trump/GOP policies this year?
Thu, 05/14/2026 - 2:05pm
Regular readers know that I've been obsessing over the massive increases in both gross as well as net premiums for ACA health insurance policy enrollees being caused by the combination of Congressional Republicans allowing the enhanced federal tax credits to expire as well as other Trump Regime policy changes for well over a year and a half now.
I've written countless analyses of how much both gross and net premiums skyrocketed from 2025 to 2026 across different states, different income levels and various other demographics...and last week it was revealed that over 3 million ACA exchange enrollees had already been priced out of the market as of April, with the number almost certain to climb further throughout the rest of 2026.
As I've repeatedly warned, however, the increases in premium costs (whether gross or net) are only half the story. The other big shoe which is dropping this year is increased out of pocket costs as millions of the ~19.2 million or so remaining enrollees as of April have been forced to downgrade their coverage to avoid (or at least minimize) those massive premium spikes.
In most cases this means moving to plans with higher deductibles, higher co-pays & higher coinsurance costs. In many cases this has also included moving to plasn with worse networks, referral requirements to see specialists and so on.
My own family is a perfect example of this: As I laid out last winter, in order to avoid a whopping $16,500 increase in our premiums this year, we had to downgrade from a Silver PPO policy to a Bronze HMO policy. The net result of this is that our premiums remained pretty much the same this year...but our deductible more than doubled from $7,800 to $17,000...and since we're guaranteed to max out that deductible as well as our total out of pocket (OOP) maximum, this basically means that we're paying $9,200 more out of pocket in order to avoid paying $17,000 more in premiums.
In other words, we're still getting screwed royally, just not as badly as we otherwise would have been.
Millions of the other ACA enrollees who aren't among the 3 million or more who have already lost coverage entirely had to make similar tough choices.
Now, in our case, there were two types of downgrades:
First, we also moved from a PPO to an HMO:
HMO stands for health maintenance organization. PPO stands for preferred provider organization.
With an HMO plan, you pick one primary care provider. All your health care services go through that doctor. That means that you need a referral before you can see any other health care professional, except in an emergency. Visits to health care professionals outside of your network typically aren’t covered by your insurance.
For example, if you get a skin rash, you wouldn’t go straight to a dermatologist. You would first go to your primary care provider, who‘d examine you. If your primary care provider can’t help you, he or she will give you a referral to a trusted dermatologist in your network that will.
...PPO plans give you flexibility. You don’t need a primary care provider. You can go to any health care professional you want without a referral — inside or outside of your network.
Staying inside your network means smaller copays and full coverage. If you choose to go outside your network, you'll have higher out-of-pocket costs, and not all services may be covered.
Unfortunately, there's no easy way for me to "calculate" how much one or the other is "costing" or "saving" us since a lot of that deals with how much time is wasted having to deal with phone calls, visiting our PCP to get approved for a referral to a specialist, etc., so I'm not even going to begin to try and analyze that here.
HOWEVER we ALSO shifted from a Silver plan to a Bronze plan.
The primary difference between these "Metal Levels" is measurable in dollars: Bronze plans have higher deductibles/other OOP costs, and there's even a simple calculation involved:
- Bronze plans are required to cover roughly ~60% of average enrollee medical claims in aggregate.
- Silver plans are required to cover roughly ~70% of claims.
There are some important caveats to both of these, but at least the "metal level" differences give me hard numbers to plug into a spreadsheet to come up with actual dollar amounts to compare.
With that in mind, that's exactly what I've decided to set out to do: Calculate the average year over year increase not just in net premiums (that is, how much more ACA enrollees are having to pay each month) but also the year over year change in average out of pocket costs.
The first of these is easy to calculate: The Centers for Medicare & Medicaid Services (CMS) has published their annual Open Enrollment Period Public Use File which includes the average gross and net premiums paid for ACA enrollees in every state. A simple comparison of these numbers for 2026 vs. 2025 gives the average increase in both. Multiply each by twelve months and voila: Done and done.
For example, according to CMS, in Alabama, the average gross premium for 2026 ACA enrollees is $743/month, which is 14.5% higher than the 2025 average of $649/month.
However, the average net premium--what's actually paid by the enrollee--has shot up from just $65/month last year to $126/month in 2026...a whopping 94% increase.
This means that Alabama ACA enrollees are paying $61 more per month on average in premiums, or $732 more per year.
Again: Easy. And remember, that's the average per enrollee, so a family of four in Alabama is being hit for an extra $2,900/year (ok, probably not that much since premiums for children under 15 are around 40% lower than they are for 40-yr olds, but you're still talking about several thousand dollars).
Now we get to the trickier part: Out of pocket spending.
The problem with this is that by definition there's usually no way of knowing for certain how much a given enrollee/household will have to pay in deductibles, co-pays or coinsurance costs in a given year. Our own situation is (hopefully) unusual: My wife requires an insanely expensive prescription injection monthly, which means we're guaranteed to hit our out of pocket ceiling no matter what until/unless she's ever able to be taken off of it.
Most people don't really know from year to year, however...you could go a full year with nothing more than the sniffles one year...and be hit by a car or diagnosed with cancer the next.
There are several resources which publish average deductibles for different health insurance markets, of course; KFF estimated that those only went up modestly* from 2025 to 2026, by about $150 on average, from $2,759 to $2,912.
*IMPORTANT UPDATE 5/19/26: This KFF estimate is from last November and was based on the assumption that existing ACA enrollees would re-enroll into the same policies. This morning KFF published a new analysis of actual 2026 ACA enrollment and determined that average ACA Marketplace deductibles actually increased by 37% (or $1,027 per person) to a record high of $3,786 in 2026...which only serves to underscore the entire point of the out of pocket cost analysis project you're reading right now!
HOWEVER, deductibles aren't the same thing as total out of pocket expenses...except in cases where they are, such as ours: Both our family deductible and our Maximum Out of Pocket (MOOP) ceiling are the same, $17,000 this year. (By the way: If you're wondering why ours is so much higher than the weighted average, keep in mind that $17,000 is the family deductible; for an individual enrollee it's half of that, or $8,500, and KFF has the average individual deductible for Bronze plans at $7,476 this year, which is much closer).
Furthermore, even knowing the average MOOP (which includes both the deductible as well as all co-pays & coinsurance that the enrollees are responsible for when visiting in-network providers) still doesn't tell you how much the average enrollee is actually paying in OOP costs.
Again: Our family's case is (presumably) an outlier. Most households likely never hit their MOOP ceiling. Some healthy enrollees may never rack up more than a couple hundred dollars in OOP costs, or even none at all.
Therefore, calculating actual average out of pocket costs becomes a real challenge...but one which I think I've come up with a fairly good formula for.
There are two keys to this calculation.
The first is the Actuarial Value of the policy. As I explained last month in my post comparing ACA coverage to employer-based coverage:
The Actuarial Value (AV) of a healthcare policy is, generally speaking, what percentage (in aggregate) of total healthcare claims that the plan provides coverage for.
Officially, ACA exchange plans have AVs of 60%, 70%, 80% or 90% (Bronze, Silver, Gold, Platinum).
Continuing to use Alabama as an example, here's what the average actuarial value of the entire statewide ACA population looks like for 2026 vs. 2025 based on Open Enrollment plan selections using the unadjusted metal level plan breakout (Catastrophic plans don't have an official AV requirement, but they generally work out to roughly 55% AV):
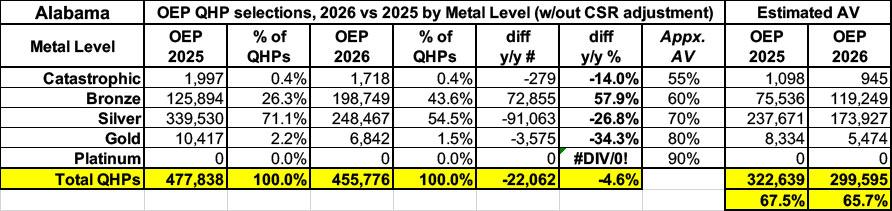
No Alabama carriers offered Platinum plans (90% AV) either year, so that's scratched off. Gold (80%), Silver (70%) and even Catastrophic (55%) enrollment dropped significantly, while Bronze plan (60%) enrollment skyrocketed. As a result, overall enrollment dropped by 4.6% (around 22,000 Alabamans)...while the average Actuarial Value of the market as a whole dropped by 1.8 percentage points.
HOWEVER, it's vitally important that this doesn't adjust for Cost Sharing Reduction (CSR) plan enrollees. This is a huge omission because a) CSR enrollees make up nearly half of all ACA enrollees in Alabama this year (down from nearly 2/3 in 2025), and b) because most CSR enrollees are in CSR 94 or 87 plans, which massively boost the Actuarial Value of Silver plans up to Platinum levels.
Technically speaking, in fact, there's actually 10 different AV levels for different types of ACA exchange plans, ranging from around 55% to as high as 99%:
- Catastrophic: Roughly 55% AV
- Bronze: Roughly 60% AV
- Extended Bronze: "up to" 65% AV...I don't have Extended Bronze data available, however.
- Silver (standard): Roughly 70% AV
- *CSR 73: Roughly 73% AV
- Gold: Roughly 80% AV
- **CSR 87: Roughly 87% AV
- Platinum: Roughly 90% AV
- ***CSR 94: Roughly 94% AV
- ****CSR AI/AN: Roughly 99% AV
*Enrollees earning between 200 - 250% FPL are eligible for CSR 73 coverage, but only if they select a Silver plan.
**Enrollees earning between 150 - 200% FPL are eligible for CSR 87 coverage, but only if they select a Silver plan.
***Enrollees earning between 100 - 150% FPL are eligible for CSR 94 coverage, but only if they select a Silver plan.
****American Indians and Alaska Natives who earn up to 300% FPL are eligible for special CSR coverage which covers pretty much everything, though I'm assuming it's 99% AV instead of 100% just out of caution. Unlike other CSR categories which are restricted to Silver plans, AI/AN CSR can be used with any metal level plan, which seems to usually be Bronze based on the limited data I have access to.
Here's what Alabama's Open Enrollment plan selection market looks like when you further break out the various CSR populations:
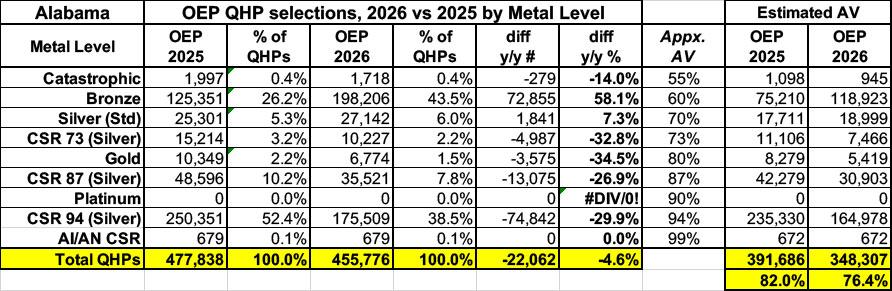
As you can see, this makes a massive difference in the overall average Actuarial Value, boosting it significantly for both years...but this also means there's a greater drop in AV from 2025 to 2026, from 82% down to 76.4% in Alabama.
OK, so now I know the average AV for both years. Great. What does this mean in actual increased out of pocket costs to the enrollees?
That's where the second key comes in...and this is the one where my calculations are on shakier ground, but it's all I have to work with: The Medical Loss Ratio of the insurance carriers for the ACA population.
Here's a brief primer on the ACA's MLR rule:
Medical loss ratio (MLR) is a measure of the percentage of premium dollars that a health plan spends on medical claims and quality improvements, versus administrative costs. The Affordable Care Act (ACA) set minimum MLR standards for health insurance in the US.
How do medical loss ratio rules work?
Obamacare (the ACA) requires health insurance carriers to spend the bulk of the premiums they collect on medical expenses for their insureds. Individual and small-group carriers must spend at least 80% of premiums on medical expenses, and for large-group plans, the requirement is 85%.
Profits and other administrative expenses can make up no more than 20% (15% for large groups) of premiums collected. If administrative expenses exceed those amounts, the insurer must remit rebates to their insureds.
(States can set higher MLR requirements: Massachusetts sets the requirement at 88% for individual and small group plans; New York’s is 82%.)
it's important to understand that just like with AV calculations, the MLR requirement applies to the aggregate population enrolled by an insurance carrier. If you're enrolled in a Bronze plan, it doesn't literally mean that your carrier will pay 60% of your specific medical expenses this year; it just means that roughly 60% of the expenses racked up by Bronze plan enrollees in aggregate have to be covered by it.
Similarly, the 80% MLR rule doesn't mean that a given insurance carrier will spend exactly 80% of your premiums on medical claims--it could be much higher or much lower than that for a specific enrollee or household. What it does mean is that if they fall below that 80% threshold, they're legally required to pay back the difference in the form of a rebate to the policyholder.
The actual formula gets a bit wonky--it's based on a 3-year rolling average, so if they only spend 75% on claims in Year 1 and hit the 80% target in Year 2 but then reach 85% in Year 3, they won't actually have to pay out rebates for the third year.
Even so, since 2011, insurance carriers have had to rebate over $13.2 BILLION back to policyholders nationally, including over $1.6 billion for 2024 alone ($1.18 billion of which went to ACA individual market enrollees).
Now, if every insurance carrier hit the 80% MLR threshold on the nose every year, I could use that in order to calculate the average total medical claims for their enrollees by simply multiplying the total premiums paid by 80%. I could then divide the premiums paid by the average Actuarial Value to get the total medical expenses (which includes both total claims plus total out of pocket expenses).
For example:
- Let's say the average premiums for a given enrollee population are exactly $500/month per enrollee, or $6,000 apiece for the year.
- If the carrier hits exactly an 80% MLR that year, it means that $4,800 of the premiums per enrollee went towards medical claims (the other $1,200 was their gross margin).
- Let's say the average AV is exactly 75%. If I divide $4,800 by 75%, it means their average total medical expenses would be around $6,400 (carrier covers $4,800, enrollee covers the other $1,600).
Again, there are several important caveats & disclaimers here; the biggest one is that it's very rare for an insurance carrier to hit exactly an 80% MLR, and I'm sure it's rarer still for every insurance carrier in a given state to hit 80%. Finally, it's virtually impossible for every carrier to hit the exact same MLR threshold two years in a row.
In other words, while the average year over year increase in net premium costs is pretty clear, the average y/y out of pocket cost increases are very broad estimates.
HOWEVER...that's all I have to work with. I'm running the numbers two ways: The first assumes an average MLR of 80% for both years, the other assumes it's 85%.
With that in mind, here's what it looks like for Alabama in 2026 vs. 2025:
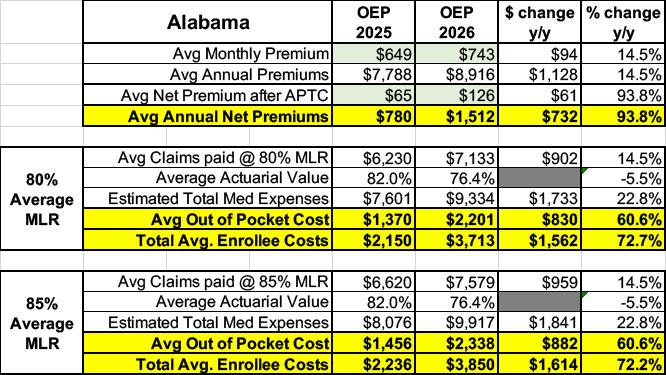
Using these assumptions, the average 2026 Alabama ACA enrollee will have to pay an average of around $1,500 in premiums plus another $2,300 or so in OOP costs, or ~$3,800 total, compared to ~$2,200 last year. That's $732 more in premiums plus an additional ~$850 or so in out of pocket expenses in the form of deductibles, co-pays & coinsurance payments, making their actual healthcare expenses ~$1,600 higher this year on average.
Over the few weeks I plan on publishing analyses like this for as many states as possible. Stay tuned...
Advertisement
