


How much more are CONNECTICUT ACA enrollees *really* paying this year due to Trump/GOP policies?
Wed, 05/27/2026 - 4:57pm
IMPORTANT: See the original post in this series for an explanation of the methodology.
Regular readers know that I've been obsessing over the massive increases in both gross as well as net premiums for ACA health insurance policy enrollees being caused by the combination of Congressional Republicans allowing the enhanced federal tax credits to expire as well as other Trump Regime policy changes for well over a year and a half now.
I've written countless analyses of how much both gross and net premiums skyrocketed from 2025 to 2026 across different states, different income levels and various other demographics...and last week it was revealed that over 3 million ACA exchange enrollees had already been priced out of the market as of April, with the number almost certain to climb further throughout the rest of 2026.
As I've repeatedly warned, however, the increases in premium costs (whether gross or net) are only half the story. The other big shoe which is dropping this year is increased out of pocket costs as millions of the ~19.2 million or so remaining enrollees as of April have been forced to downgrade their coverage to avoid (or at least minimize) those massive premium spikes.
In most cases this means moving to plans with higher deductibles, higher co-pays & higher coinsurance costs. In many cases this has also included moving to plasn with worse networks, referral requirements to see specialists and so on.
With that in mind, that's exactly what I've decided to set out to do: Calculate the average year over year increase not just in net premiums but also the year over year change in average out of pocket costs.
Let's take a look at CONNECTICUT.
Here's total Open Enrollment plan selections for both 2025 & 2026 broken out by raw metal level:
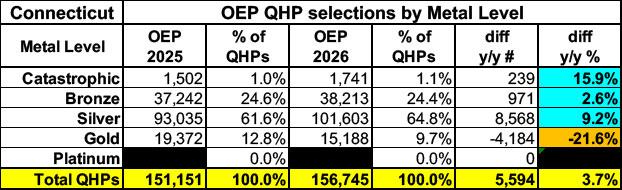
As I explained at length in the original post, simply looking at the official metal level breakout is misleading because a huge chunk of ACA enrollees are low-income enough to be eligible for Cost Sharing Reduction (CSR) assistance, which boosts Silver plans up to Platinum levels of AV for most CSR enrollees. You have to adjust for that in order to find the weighted average Actuarial Value, which is actually up slightly year over year in Connecticut:
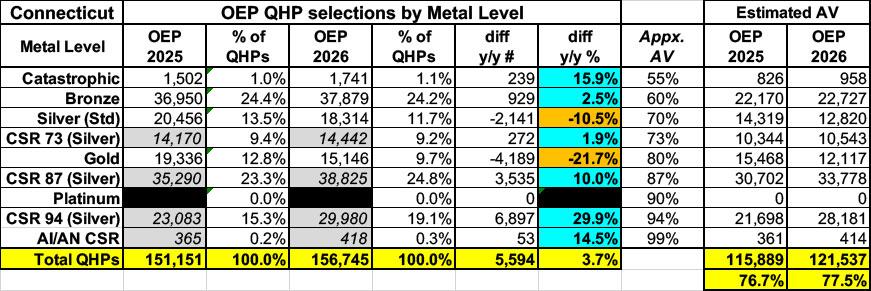
IMPORTANT: I only have detailed CSR category enrollment data for the 30 states hosted via the federal ACA exchange, HealthCare.Gov. Unfortunately, the Centers for Medicare & Medicaid Services (CMS) only provides total CSR enrollment for most of the 21 state-based exchanges (SBEs).
For these states, which includes Connecticut, I'm instead relying on rough estimates based on the percent of enrollees in the 100 - 150%, 150 - 200% and 200 - 250% FPL income brackets who selected Silver plans each year, which can be found in the 2025 & 2026 OEP State, Metal Level, and Enrollment Status Public Use Files (ZIP) from CMS.
These percentages, when converted into raw numbers, correspond fairly closely to the actual CSR category breakouts for FFM states (+ or - 5%), so they should be close enough for my purposes. I've also come up with rough estimates for the AI/AN CSR category based on comparisons of the percent of AI/AN CSR QHPs selected in FFM states to the percent of AI/AN residents within each state. This is less than 3.3% in every SBE state except for New Mexico.
Again, these are broad estimates only but should be reasonably accurate for this project.
I was surprised to discover that Connecticut is the first state where the overall average Actuarial Value increased slightly this year, from 76.7% to 77.5%, which should have a positive impact on out of pocket costs.
By combining these numbers with the average gross premiums per enrollee I'm able to calculate an estimate of the average total medical expenses each enrollee racks up each year assuming an 80% average Medical Loss Ratio (which, as I stated in the original post, can vary widely by carrier and year, so this should be considered a very broad average only).
However, there's another important factor here: Connecticut (along with some other SBE states) is a special case because they're offering SUPPLEMENTAL STATE-BASED SUBSIDIES on top of the (reduced) federal tax credits this year.
Households with an annual income between 100% and 200% of the Federal Poverty Level (FPL), who are not already enrolled in the Covered CT Program, will receive a state subsidy to replace 100% of the expired enhanced premium tax credits.
Households with an annual income over 400% and up to 500% FPL will receive a receive a state subsidy to replace 50% of the expired enhanced premium tax credits.
The state subsidies are currently in place for one year.
I don't have the exact dollar figures for each of these populations available, but according to the original press release when the state subsidy was announced, the state expects it to cost around $70 million for the full year, which would break out to an average of roughly $447 in additional savings per enrollee, or $37/month (I'm dividing across all enrollees whether they qualify for the state subsidies or not to get the overall average).
Here's what all of this looks like, with columns for 2025, 2026 without the state subsidies and 2026 with the state subsidies in place:
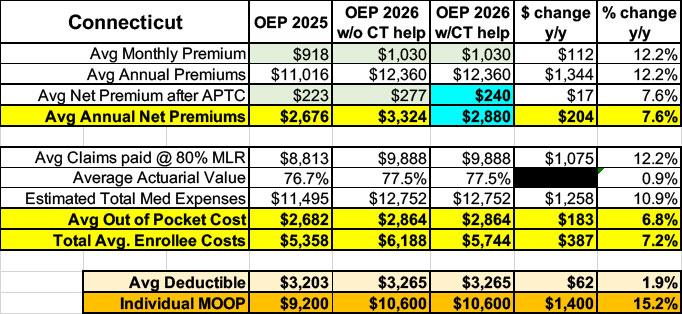
WITHOUT the additional Connecticut subsidies, net 2026 premiums would have averaged ~$277/month, or 24.2% higher than they were in 2025. With the extra financial assistance, this is knocked down to just $240/month...a mere 7.6% net increase, which is remarkably low under the circumstances.
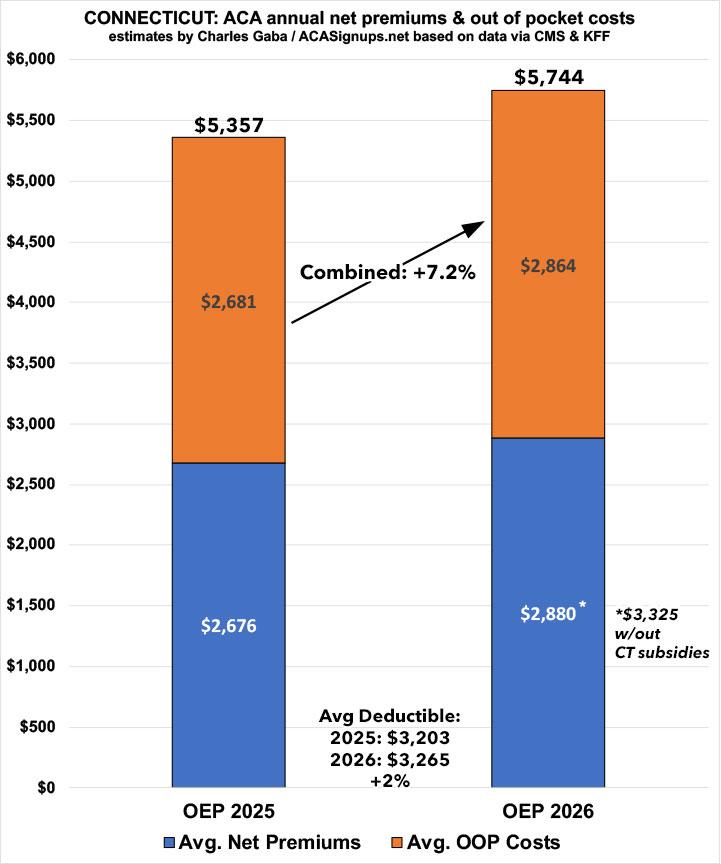
Meanwhile, thanks to the average actuarial value increasing slightly, Connecticut enrollees look to "only" see their average out of pocket costs increase by a similarly modest 6.8%, for a combined average yearly healthcare spending increase of just 7.2%, or $387/person.
This likely also helps explain why Connecticut is one of the handful of states where total Open Enrollment plan selections increased this year.
On the one hand, the overall increase is surprisingly low compared to every other state I've looked at so far. Then again, you have to keep this in perspective: Unsubsidized premiums in Connecticut are already averaging over $1,000/month to begin with.
In addition, based on KFF's net data, average deductibles also went up by a mere 2% to around $3,265 for single coverage this year, although the maximum (theoretical) out of pocket cut-off for all ACA enrollees went up by over 15% this years as well, to $10,600 for single coverage.
Next up: DELAWARE.
Advertisement


